We are a small engineering studio building web GIS platforms and applied Earth Observation systems. Below is what we have delivered. Some engagements are covered by confidentiality, so client names are withheld.
Natural-language field intelligence over satellite imagery
SaltGIS platform, adapted per client
Our in-house analysis platform. We deploy it against a client's own parcels, imagery and agronomic rules rather than starting every engagement from an empty repository.
The problem
Agronomists and loss adjusters sit on years of satellite coverage they cannot query. Answering a question as simple as which parcels lost vigour since the last visit means a GIS specialist, a desktop session and a day of work. The specialist becomes the bottleneck for every decision.
What we built
Natural-language layer that translates a plain question into a spatial query, runs it against the parcel index, and returns maps and numbers alongside a written explanation.
Index engine computing NDVI, NDWI and red-edge series per parcel, with date-over-date comparison so change is detected rather than eyeballed.
Parcel health scoring that attaches results to real cadastral boundaries, not raster tiles, so findings map onto the units a business actually operates on.
Map-native annotation: pin a finding, assign it to a field crew, export the result set as CSV or GeoJSON for the systems already in use.
Outcome
Field staff answer their own spatial questions without routing through a GIS specialist
Crop stress surfaces weeks before it is visible on a ground inspection
Reports read by people who have never opened a GIS package
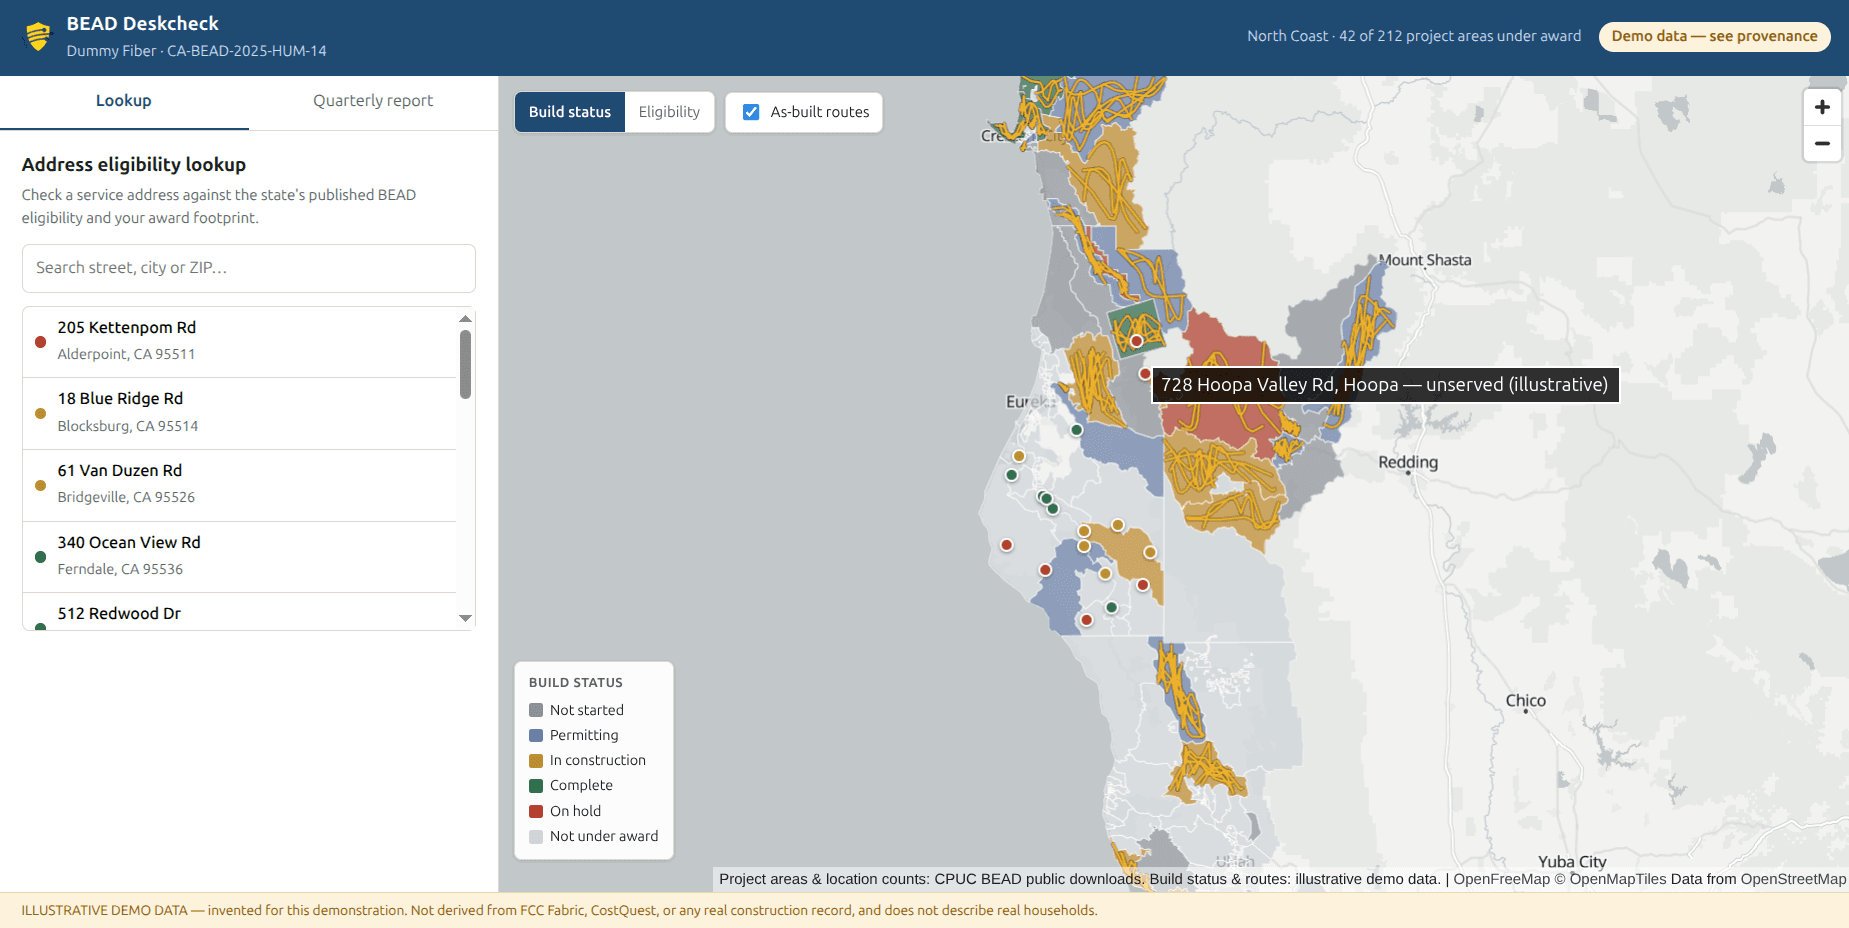
Award footprint coloured by build status with the as-built fibre layer on top, and the address eligibility lookup alongside it.
Broadband and grant compliance2026
BEAD Deskcheck
Quarterly BEAD compliance packets generated from the provider's own build data
SaltGIS build, deployed per provider
A compliance dashboard for the internet service provider doing the filing: address eligibility lookup, build status map, as-built route layer and a quarterly packet in PDF and XLSX. Shown here on California's public CPUC award data, with build progress and fibre routes carried as clearly labelled demonstration layers until a provider's own records are loaded.
The problem
A BEAD subgrantee reports every quarter against milestones it committed to years earlier. The evidence lives in a state shapefile, a construction log, a spreadsheet of passes and a folder of route exports, and the packet is assembled by hand each time the deadline comes round. The tools that exist are either bundled into ISP billing platforms or sold to states as enterprise grant-administration suites. Nothing standalone serves the provider that has to file.
What we built
Address eligibility lookup against the state's published unserved and underserved files, answering whether a given service address sits inside the award footprint and what it is classified as.
Build status map over MapLibre GL: project areas coloured by construction status with the as-built fibre layer on top, running with no map vendor token and degrading to a notice rather than a blank page where WebGL is unavailable.
A milestone rule simple enough to defend to a programme officer: complete when passes are delivered, behind when the committed date has passed, at risk when completed share trails elapsed share of the build window by more than 15 points. Every figure in the table recomputes by hand from its own row.
Quarterly packet generated as PDF and XLSX from the same data the screen shows, with the footprint map drawn as vector straight from PostGIS rather than fetched from a static-image API, so it stays sharp in print and regenerates on a laptop with no internet.
As of is pinned to the end of the reported quarter, not today, so re-running an earlier quarter restates that quarter rather than silently rewriting history.
Provenance enforced in the schema rather than by convention: every invented table carries an is_demo column and every API response carries a required provenance field, so authoritative state figures and illustrative layers cannot quietly merge in a chart.
No licensed Location IDs anywhere. Raw Fabric and CostQuest identifiers are dropped during ETL and never reach the database, so the finest grain any query can reach is a per-project-area count.
ETL over the state shapefile and latin-1 CSVs that normalises two incompatible project-area ID formats, joining all 14,665 records with none unmatched in either direction.
One shared TypeScript package of domain types, schemas and palette imported by both the API and the web client, so the map legend and the printed report cannot disagree.
Outcome
The quarterly packet regenerates on demand instead of being rebuilt by hand before every deadline
Milestone exposure reads worst-first, so slippage is known before a programme officer raises it
Every compliance figure is traceable to a stated source, and demo layers are labelled as demo
Licensed location identifiers cannot leak, because no table holds one
Runs offline on a laptop, with no map vendor account and no per-tile billing
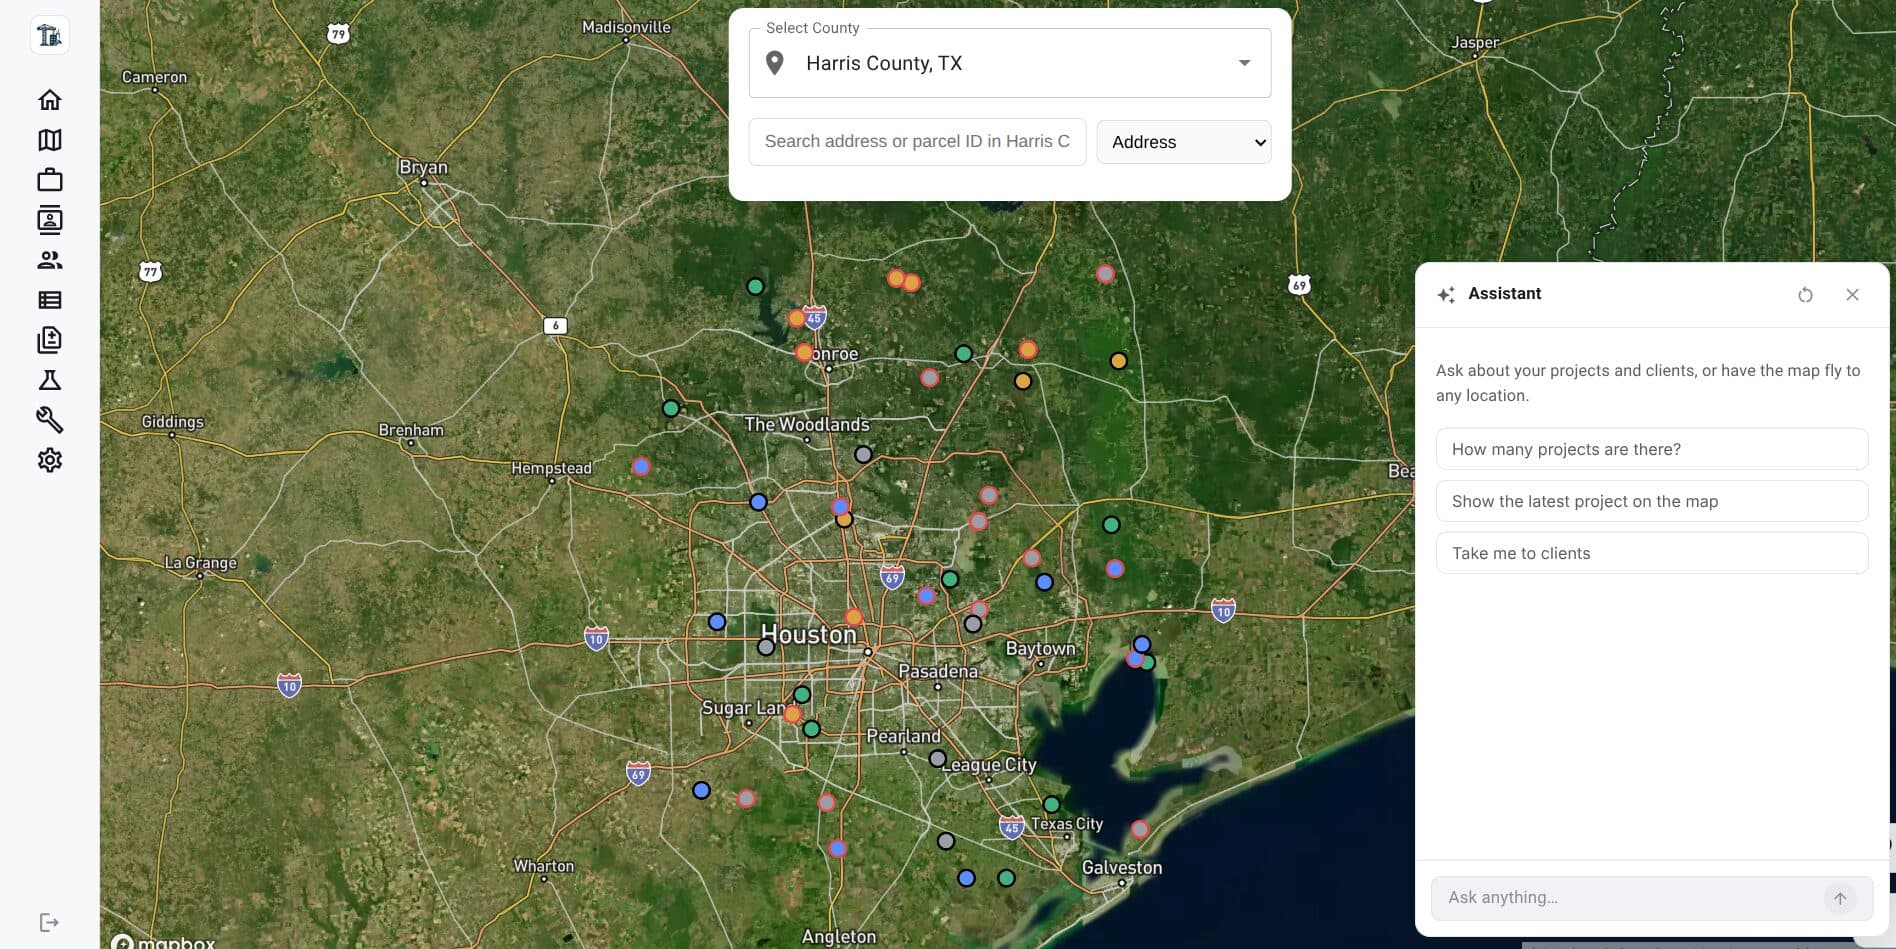
County-first project map. Projects sit on the parcel layer and are searchable by address or parcel ID, with the assistant answering questions against the same data.
Land surveying and construction2026
ConstructionFlow
Project, client and document management with automated title research
Land surveying firm, Texas, United States
An operations platform for a land surveying firm. Projects, clients, employees and inquiries live in one system on a parcel-aware map, and the research that used to precede every survey is now a workflow the software runs itself.
The problem
Every survey starts with the same unpaid week: pull the county appraisal record, find the deed, chase the deeds of every adjoining tract, retrieve the FEMA flood map, screenshot the GIS and CAD extents, then file all of it under a naming convention that only holds if everyone remembers it. The firm tracked projects in spreadsheets, kept documents in ad hoc folders, and had no way to see where a job stood without asking the person running it.
What we built
Parcel-aware project map over Mapbox GL: every project is a point on the county parcel layer, searchable by address or parcel ID, with Harris, Fort Bend and Montgomery county appraisal data imported into PostgreSQL and filtered county-first.
Research automation pipeline that provisions the project number and folder structure, gathers county records and deeds, retrieves the most recent deed for every immediate adjoining tract via spatial neighbour queries, pulls the FEMA National Flood Hazard Layer for flood zone, BFE and FIRM panel, captures GIS and CAD map screenshots, files everything and advances the project to Fieldwork Pending.
Paywall and access-restriction handling: where a county record cannot be retrieved, the run captures a document preview, writes a labelled restricted-access record and generates step-by-step manual research instructions instead of failing silently.
Standardised document labelling across every artefact - file number, timestamp, document type, county and parcel ID - so a folder is legible without opening a single file.
Automation hub for the workflows after research: field work preparation, CAD file processing, quality control checks, survey report and invoice generation, each with live step-by-step progress in the browser.
Embedded AI assistant with read-only database access that answers questions about projects and clients in plain language, flies the map to any location and navigates the app on the user's behalf.
Role-scoped field portal where crew check in and out against assigned projects, with attendance and logged hours rolling into the office dashboard.
Express and TypeScript API over PostgreSQL with JWT auth, React and Vite front end, and shell-scriptable pipelines so the same automation runs headless in batch.
Outcome
Pre-survey research runs as a single 15-20 minute workflow instead of a manual day
Adjoining tract deeds and FEMA flood determinations gathered without a human visiting three county portals
Every project document lands correctly named and filed, so nothing is searched for twice
Office sees project status, hours and payments live rather than by asking
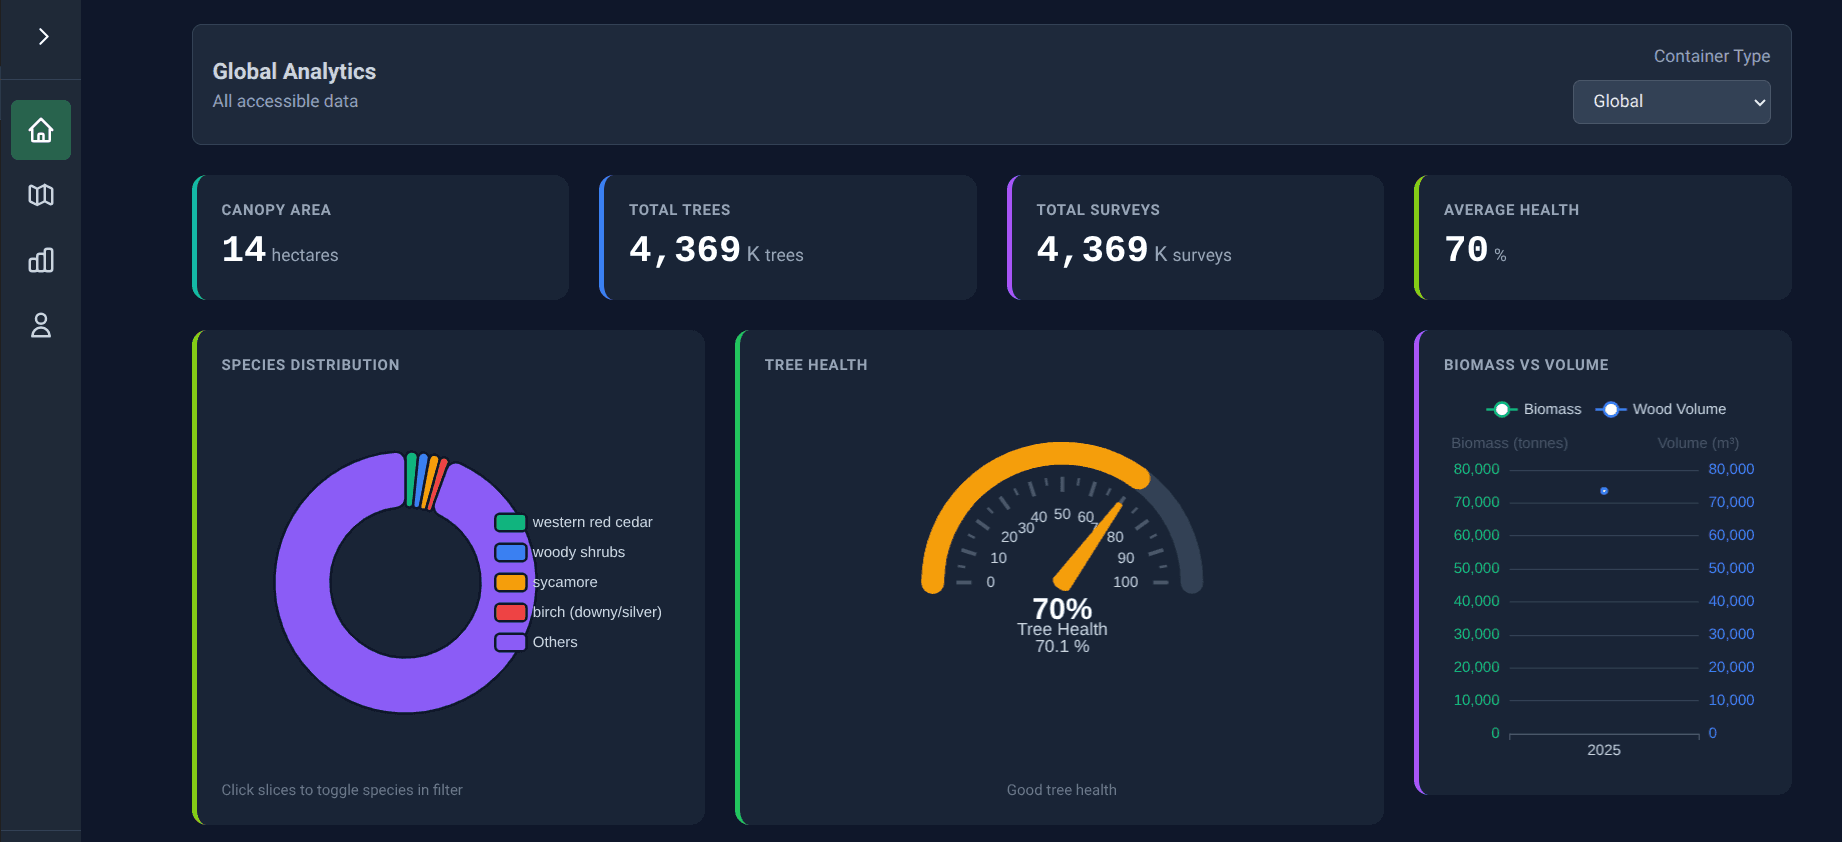
Estate-level roll-up: canopy area, tree count, survey count and mean health, with species distribution and biomass against timber volume.
Forestry and carbon2025
Forest Asset Intelligence Platform
Multi-tenant inventory and analytics for individually surveyed trees
Forestry asset-management group, United Kingdom
A full platform build for a UK forestry group managing estates on behalf of multiple landowners. Every tree is a record, every survey is versioned, and the whole estate rolls up into carbon and timber figures the business can act on.
The problem
The client held drone and field survey data for hundreds of thousands of individual trees across estates belonging to different landowners. It lived in shapefiles and spreadsheets. Nothing enforced the boundary between one landowner's data and another's, nobody could see an estate-level carbon figure without a manual rebuild, and each new survey meant redoing the analysis by hand.
What we built
Hierarchical spatial data model in GeoDjango and PostGIS: organisation to forest to compartment to subcompartment to tree, with each level carrying its own geometry so aggregation happens in the database rather than the browser.
Multi-tenant isolation enforced at the queryset layer and bound to Django's auth and permission system, so a landowner's data cannot leak across an organisation boundary regardless of the endpoint hit.
Survey pipeline computing 16 derived metrics per record - DBH, height, trunk, branch and total volume, convex and shape-based crown area and volume, carbon mass, health score and the EVI, NDVI, NDRE and water index values from the imagery.
Shapefile ingestion path that validates, reprojects and bulk-loads survey deliveries, turning a data drop into queryable records without manual GIS work.
React and Mapbox GL front end rendering canopy polygons at estate scale, with server-side hexbin aggregation so a map of hundreds of thousands of trees stays interactive.
Self-service analytics board: users compose scatter, histogram and donut charts against any metric pair, colour by any level of the hierarchy, and attach notes - no engineering ticket needed for a new chart.
PDF report generation and Brotli/zstd response compression to keep large geometry payloads fast over ordinary connections.
Containerised with Docker and deployed on DigitalOcean, with JWT authentication across the API surface.
Outcome
Carbon sequestration, biomass and timber volume roll up from single trees to the whole estate on demand
Landowner data isolation enforced in code rather than by convention
New surveys land as a file upload instead of a GIS project
Analysts build their own charts, removing the standing queue of reporting requests
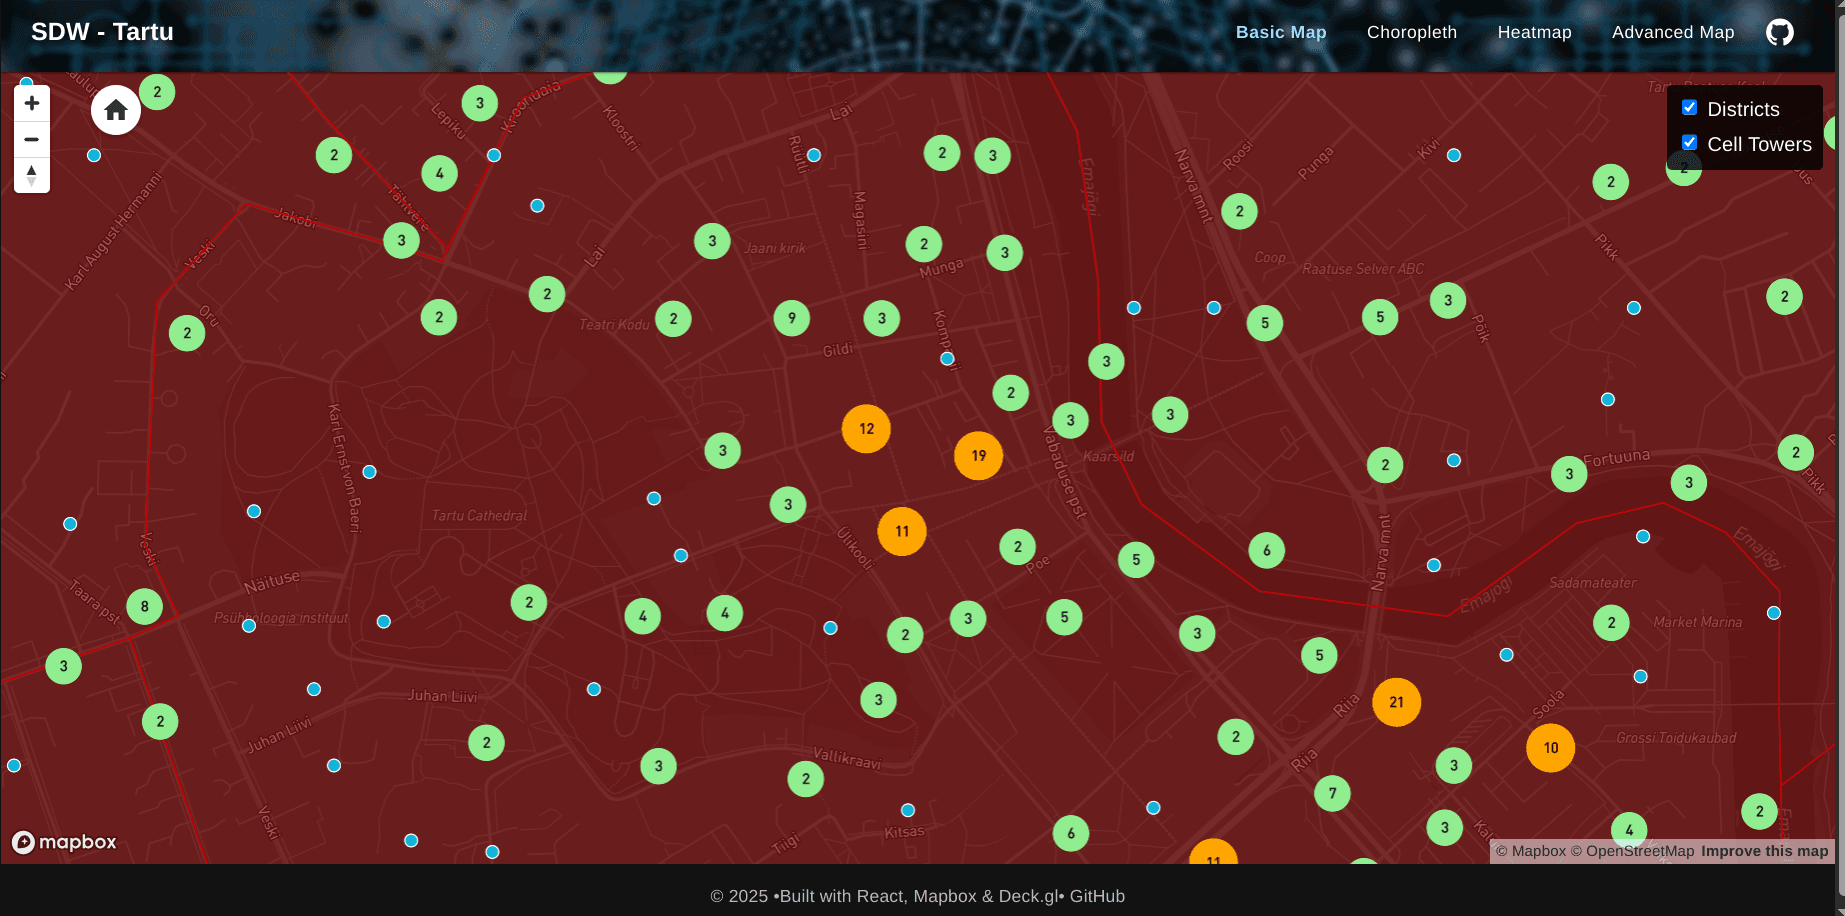
Tower positions and modelled signal strength rendered client-side with Deck.gl.
Telecommunications2024
Network Coverage Explorer
WebGL rendering of cell tower coverage and signal strength
Telecommunications infrastructure analysis
An interactive coverage map for a city-scale cell tower network, built to make signal strength and coverage gaps legible to planners without a GIS background.
The problem
Coverage analysis lived in static exports. Comparing operators, spotting dead zones or explaining a coverage decision to a non-technical stakeholder meant regenerating images every time the question changed.
What we built
Deck.gl and WebGL rendering layer so the full tower and signal dataset draws client-side at interactive frame rates.
Layered visualisation of tower positions against modelled signal strength, letting coverage gaps read directly off the map.
GeoJSON data pipeline over a Mapbox base, keeping the deployment a static bundle with no server dependency.
Outcome
Coverage questions answered by panning a live map rather than commissioning a new export
Dead zones visible to planners with no GIS training