Europe’s farmland is a mosaic: smaller parcels, frequent hedgerows, villages and roads woven between fields, and a long history of mixed farming. Compare that to very large plots and extensive monocultures typical of the U.S. Midwest or parts of Brazil and Australia. This spatial pattern makes ecology and production tightly coupled.
Decision-making is also different. In many regions, market prices and yield dominate. In Europe, policy alignment is foundational: environmental standards and subsidy conditions shape cropping plans, field operations, and record‑keeping.
- More boundaries → more buffers, setbacks, and habitat features to map.
- Frequent cloud cover → need compositing and QA for satellite time‑series.
- Policy checks are per‑parcel → geometry accuracy and versioning matter.
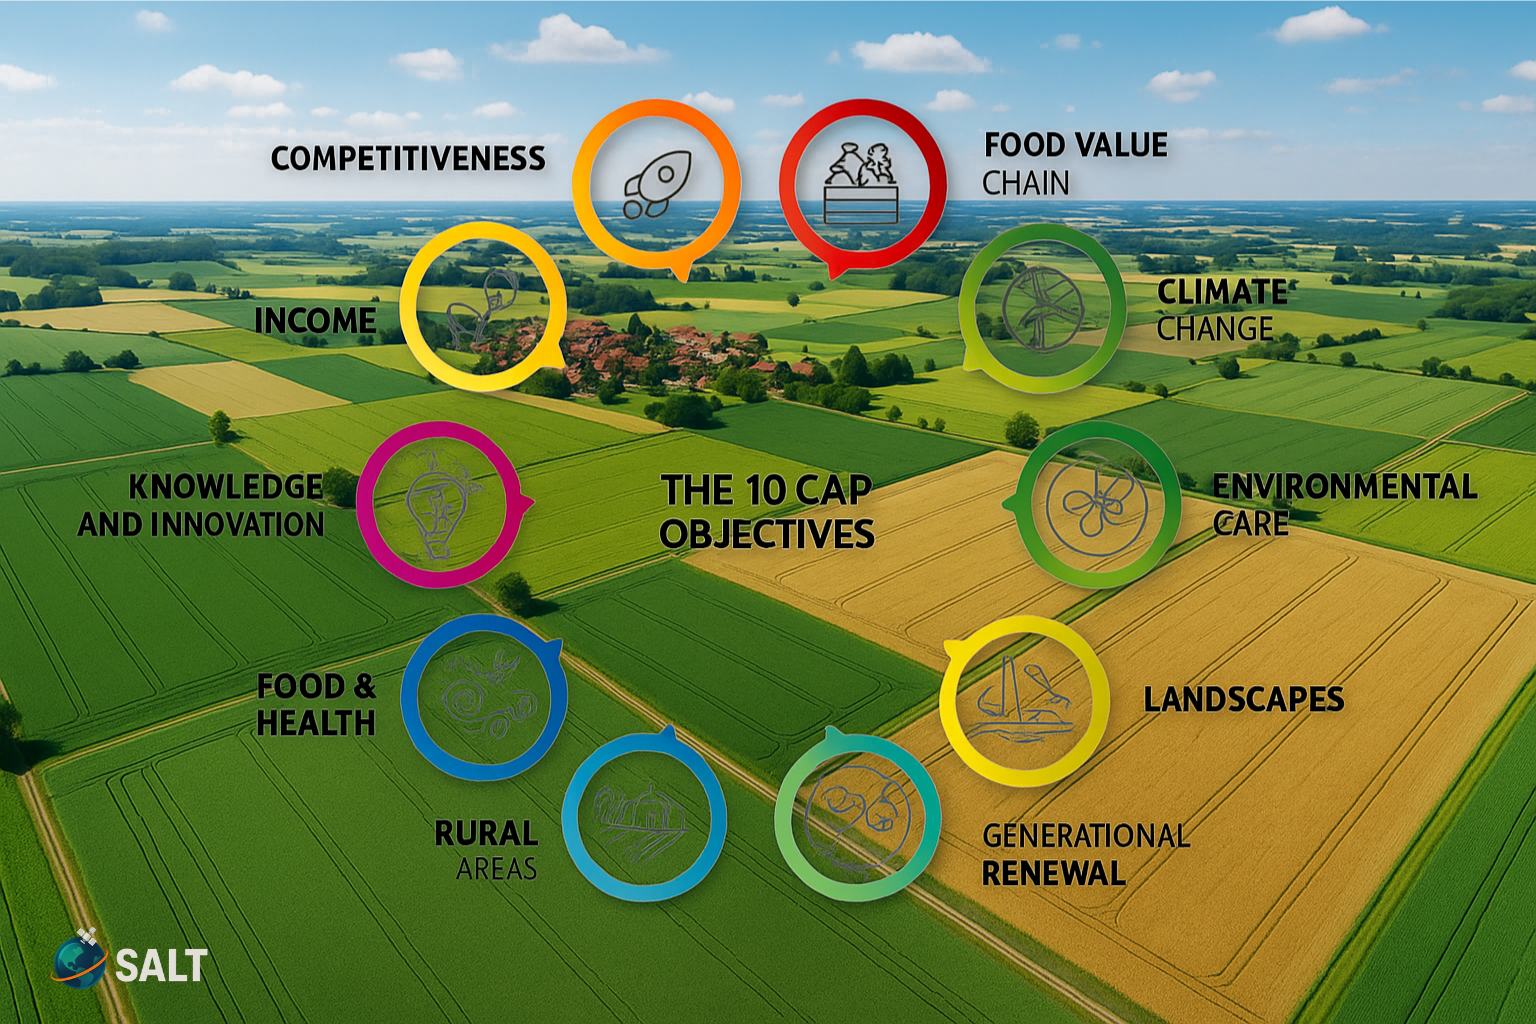
The Common Agricultural Policy (CAP), active since 1962, remains roughly one-third of the EU budget. It is the EU’s main financial instrument for agriculture, designed to keep farming competitive while also protecting the environment. Access to this funding depends on meeting environmental standards and management rules. The current framework emphasizes a “green architecture” and includes Good Agricultural and Environmental Conditions (GAEC) standards.
CAP is more than a subsidy system, it is the backbone of European agriculture. For farmers, it provides direct income support that can mean the difference between profit and loss in volatile markets. For citizens, it ensures stable and affordable food supplies. For rural communities, it funds modernization, infrastructure, and diversification projects. And for the environment, CAP enforces climate- and nature-friendly practices by linking payments to compliance with ecological rules.
In short, CAP balances economic viability with environmental stewardship. It aims to make sure European farms remain productive while protecting soil, water, biodiversity, and climate.
- GAEC 1 Maintain permanent grassland share → monitor conversions & mowing windows.
- GAEC 4 Buffers along watercourses → verify width and continuity of vegetated strips.
- GAEC 6 Minimum soil cover → detect winter bare soil vs cover crops.
- GAEC 8 Non-productive features → hedgerows, tree lines, fallows, margins.
What it means for different groups:
- Farmers: CAP ensures steady income support (basic payments), covers part of the cost of sustainable practices (eco-schemes), and funds rural investments (farm upgrades, diversification). But compliance is non-negotiable: missing GAEC checks can reduce payments.
- Citizens & consumers: CAP underpins food security in Europe, stabilizes prices, and promotes healthier, more sustainable food systems aligned with the EU’s Green Deal.
- Policy & auditors: CAP is the mechanism for enforcing EU environmental rules at farm level. Evidence-based monitoring ensures public money is tied to measurable outcomes.
- GIS & remote sensing professionals: CAP creates a direct demand for geospatial monitoring, satellite indices for soil cover, AI for hedgerow detection, parcel mapping, and digital audit trails. It is one of the largest drivers of Earth observation use in Europe.
Inspecting every field on the ground is impractical. Satellite EO (e.g., Sentinel‑2, Landsat) and GIS workflows make it possible to monitor conditions consistently across seasons and countries. What matters is not a single image, but a quality‑controlled time series and transparent methods.
These workflows translate policy into measurable conditions at parcel scale. We package them into practical tools — from per‑parcel metrics to ready‑to‑serve map tiles — so teams can operationalize CAP checks without wading through raw EO.
- Mask clouds/shadows (QA60/SCL; fMask optional); compute % valid pixels.
- Build 14–30‑day rolling median composites per parcel; keep acquisition counts.
- Detect conditions: cover vs bare (NDVI/EVI2 + hysteresis), red‑edge chlorophyll in early growth, hedgerow continuity, buffer vegetation.
- Export per‑parcel metrics + map tiles + method card (sensor, dates, thresholds).
- LPIS parcel geometries (Member State reference).
- Copernicus Sentinel‑2 MSI; HLS (harmonized Landsat‑Sentinel) for consistency.
- Copernicus HRLs (Tree Cover, Grassland), Corine Land Cover for context.
- EU‑Hydro / national hydrography for buffer checks.
- LUCAS in‑situ points/photos; EuroCrops for crop‑type context.
Independent EU analysis in 2025 found that CAP admin averages ~7 working days per farm per year, costing about €1,230 on average. The heaviest steps are the annual aid application and compiling/organizing evidence for conditionality checks. These findings fed directly into the Commission’s 2024–2025 simplification package.
- Annual aid application + parcel updates (LPIS edits, split/merge, boundary tweaks).
- Collecting proof for conditionality (soil cover windows, buffers, mowing/harvest dates).
- Answering control queries; handling exception cases and on-the-spot checks.
- Keeping audit-ready logs (maps, dates, photos, method notes) per parcel.
- Checks-by-Monitoring (AMS): Sentinel time-series flag parcels that are OK vs. “needs attention”, so inspections focus on exceptions instead of everyone.
- LPIS sync in farm systems: GIS platforms can auto-pull parcel geometry/IDs; pre-fill declarations and avoid repeated boundary edits.
- Evidence-as-a-file: GIS workflows can auto-generate parcel-linked reports with sensor/date/method cards and thumbnails — ready for upload or audit.
- Early-warning tasks: Remote-sensing triggers (e.g., bare soil or missing buffer) can prompt corrective actions before inspectors intervene.
- Parcel sync + change assist: Detect splits/merges automatically and suggest geometry edits before application deadlines.
- Satellite proof packs: Auto-generate PDFs with Sentinel-2 thumbnails, dates, and GAEC tags (e.g., GAEC 6 soil cover).
- Exception dashboards: Traffic-light flags (OK/Warning/Action) per parcel from NDVI, soil cover, or buffer indicators.
- Submission-ready exports: Bundle parcel reports and metadata into standardized exports for audits.
- Advisor dashboards: Multi-farm views that let consultants triage where intervention saves the most time.
- Fewer on-site checks: Exception-only targeting reduces field visits for compliant parcels.
- Cleaner submissions: Pre-filled forms from synced parcels cut re-entry and mismatches.
- Audit-ready by default: Every map tile and date is traceable with sensor, processing, and cloud metadata.
- Predictable deadlines: Early warnings turn “surprises” into planned field tasks.
Illustrative ROI (per farm)
If a farmer spends ~7 days/yr on CAP admin, and GIS-driven monitoring can cut even 30% of that via AMS flags, parcel sync, and auto-proof packs, that’s ~2 days saved. At €25–€40/hour effective cost, this equals roughly €400–€640/year saved — before counting avoided penalties or reduced site visits. Scenario is illustrative; actuals vary by member state and crop system.
- European Court of Auditors — CAP share of EU budget (~31%).
- EEA — Common bird index; farmland bird declines since 1990.
- PECBMS — Pan‑European farmland bird indicator (since 1980).
- European Commission — IACS/LPIS overview and audit chain.
- JRC — Conceptual basis of Checks by Monitoring (CAP AMS, Sentinel-based monitoring).
- EU CAP Network study (2025) — Administrative burden/time and average cost per farm; underpinning Commission simplification package.
- European Parliament EPRS brief (2025) — Summary of administrative burden study (avg ~7 working days; ~€1,230 cost).
- Copernicus Data Space — Sentinel-2 MSI specifications.
- Harmonized Landsat–Sentinel (HLS) — consistency across sensors.
- Copernicus HRLs & Corine Land Cover; EU‑Hydro.
- LUCAS in‑situ points/photos; EuroCrops crop polygons.
Disclaimer: This article is for informational purposes only. CAP compliance requirements vary by Member State and farm context. Scenarios described are illustrative and not a guarantee of eligibility or savings.